Have you ever tried to wrap your head around complicated data or lengthy reports, only to find your eyes glazing over after a few paragraphs? Infographics to the rescue. Using visuals like charts, graphs, maps, and illustrations, infographics transform boring information into engaging stories that are easy to understand at a glance.
On 99designs, thousands of talented designers from around the world create custom infographics to help businesses, organizations, and individuals communicate their messages in memorable ways. Whether it’s showcasing key metrics, explaining a complex process, or highlighting trends, infographics pack a tonne of information into a visually arresting format. In this post, we’ll explore some of the most impactful infographics designed through 99designs and break down what makes them so effective. By the end, you’ll see why infographics have become such a powerful tool for brands looking to connect with their audiences.
The Power of Visualising Information
Infographics are powerful tools for conveying complex information in an easy-to-understand way. By transforming data into visual representations, infographics allow us to see relationships, patterns, and insights that would otherwise remain hidden in spreadsheets or reports.
At 99designs, our designers have created stunning infographics on every topic imaginable. Want to show how sustainable energy usage has grown over the past decade? An infographic can visualize that trend through a simple line graph. Need to compare nutritional information for different fast food options? We’ve designed infographics that use images of each menu item along with charts showing calories, fat, and other stats.
Infographics are ideal for an “at-a-glance” understanding of almost any subject. Their visual nature means we can process the information much faster than reading a lengthy article. We instantly see key insights, correlations, and conclusions that would take paragraphs of text to explain.
Whether your goal is to educate, inform brand awareness, or go viral, infographics are a powerful way to spread your message. At 99designs, our global community of designers is experts at distilling data into visually stunning creations that people want to read and share. Infographics might just be the perfect marriage of form and function.

Examples of Stunning Infographics From 99designs
Infographics are visual representations of information that make data and ideas easy to understand. At 99designs, designers have created stunning infographics on every topic imaginable. Here are a few examples that demonstrate the power of infographics to communicate complex topics.
The Evolution of the Super Bowl Commercial
This infographic tracks how Super Bowl commercials have changed over the last 50 years. Using eye-catching graphics, it explores trends like increasing costs, shifting to social media, and moving to storytelling. In a single glance, you can see how short films and social campaigns have replaced basic product demos.
A Day in the Life of the World’s Most Typical Person
This colorful infographic imagines a ‘typical’ day for the median human based on global statistics. From waking up at 6:30 am to eating three meals a day and living with 4.4 other people, it brings global data to life in an engaging way. The minimal text and vibrant visuals make a topic that could be dry and dull surprisingly compelling.
How We Spend Our Lifetime
This infographic breaks down the average human lifetime of 79 years into days and hours spent on various activities. On a lifetime scale, we spend roughly 9 years eating, 7 years exercising, and 6 years socializing. Infographics like this one give us a chance to step back and consider how we choose to spend this finite time we have.
Using creative visuals and minimal text, infographics transform mounds of data into a story that people want to read and share. 99designs designers are experts at crafting infographics that make you think about information in a whole new light.
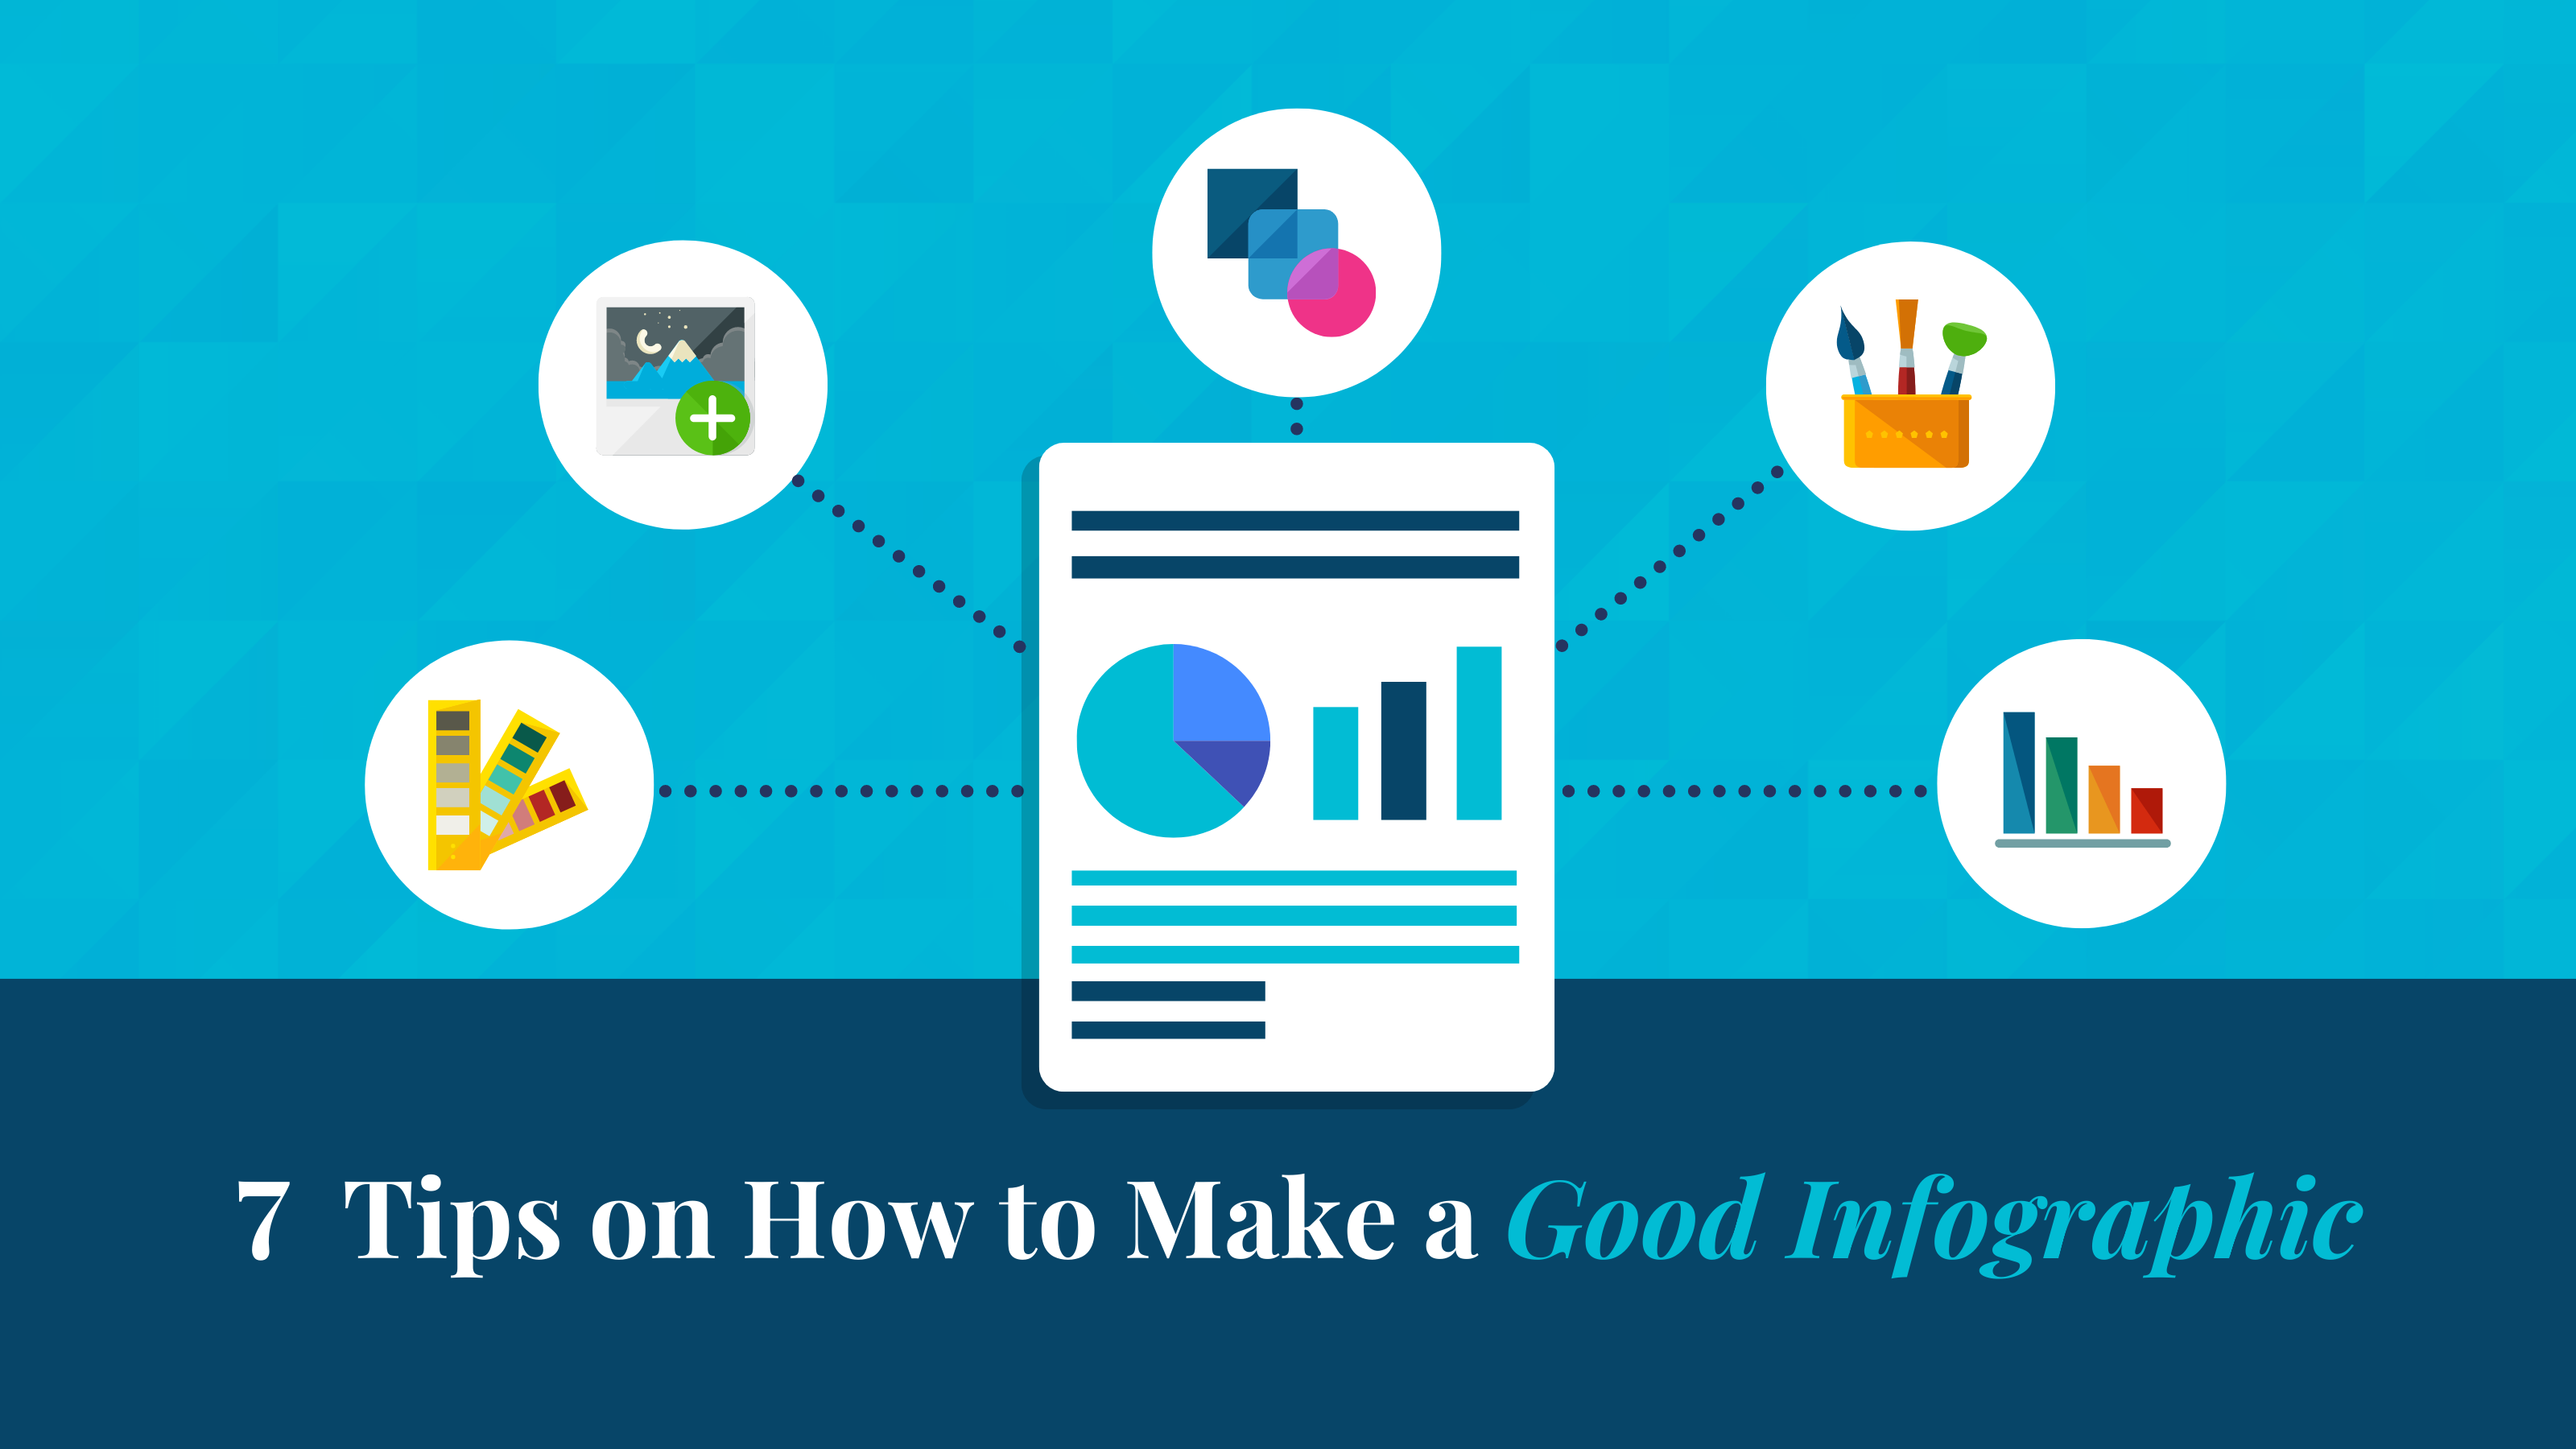
How to Create an Effective Infographic With 99designs
Creating an infographic with 99designs is a powerful way to convey complex data and ideas in an easy-to-understand, visually engaging format. Here are some tips to craft an effective infographic:
Choose a focused topic
Select a specific angle or story you want to highlight from your data or research. An infographic should convey one main message or idea.
Decide on a visual style
Do you want a minimalist, colorful, or retro style? 99designs has designers with expertise in many visual styles. Provide examples of infographics you like to help the designers understand your vision.
Provide ample data and context
Give the designers all the relevant data, statistics, facts, examples, and anecdotes they need to illustrate your story. Explain the overall context and arguments to help them understand how to best visualize the information.
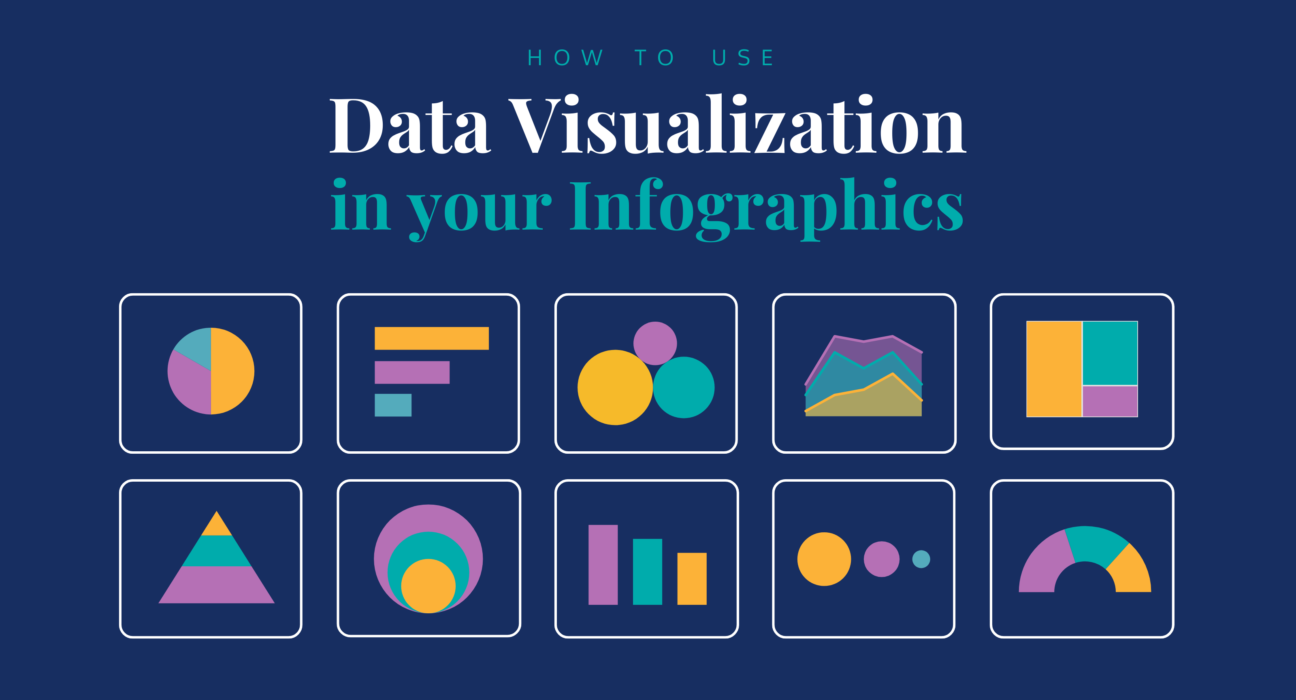
Use a simple, balanced layout
An uncluttered layout with negative space makes information easy to digest. Balance text, data, and visuals. Use flow charts, graphs, icons, maps, or timelines to display data engagingly.
Make it scannable
Use bulleted lists, bold headings, and ample whitespace so readers can quickly find what interests them. The key insights and takeaways should be immediately apparent.
Review and revise
Work with your designer to review the draft infographic and suggest any changes to the content, layout, or visual style needed to make it as compelling and impactful as possible.
Infographics are an art form that can make data beautiful. With 99designs, you have access to professional designers who can craft an infographic that brings your topic to life and makes information accessible to a wide audience.
Conclusion
Infographics have the power to turn even the driest data into beautiful visual stories. As you’ve seen, 99designs has an army of talented designers who can transform statistics and facts into colorful infographic masterpieces. Whether you need to educate your customers, engage your social media followers, or simply bring some visual spice to your next company report, infographics are a brilliant way to spread your message. So what are you waiting for? It’s time to unleash your inner data storyteller. Head to 99designs, describe your vision and let the design magic happen. Before you know it, you’ll have an infographic to make any data lover swoon. The result will be insightful, impactful, and downright gorgeous – just like the many examples you’ve explored today. Infographics: making the world a more visually interesting place, one data set at a time.